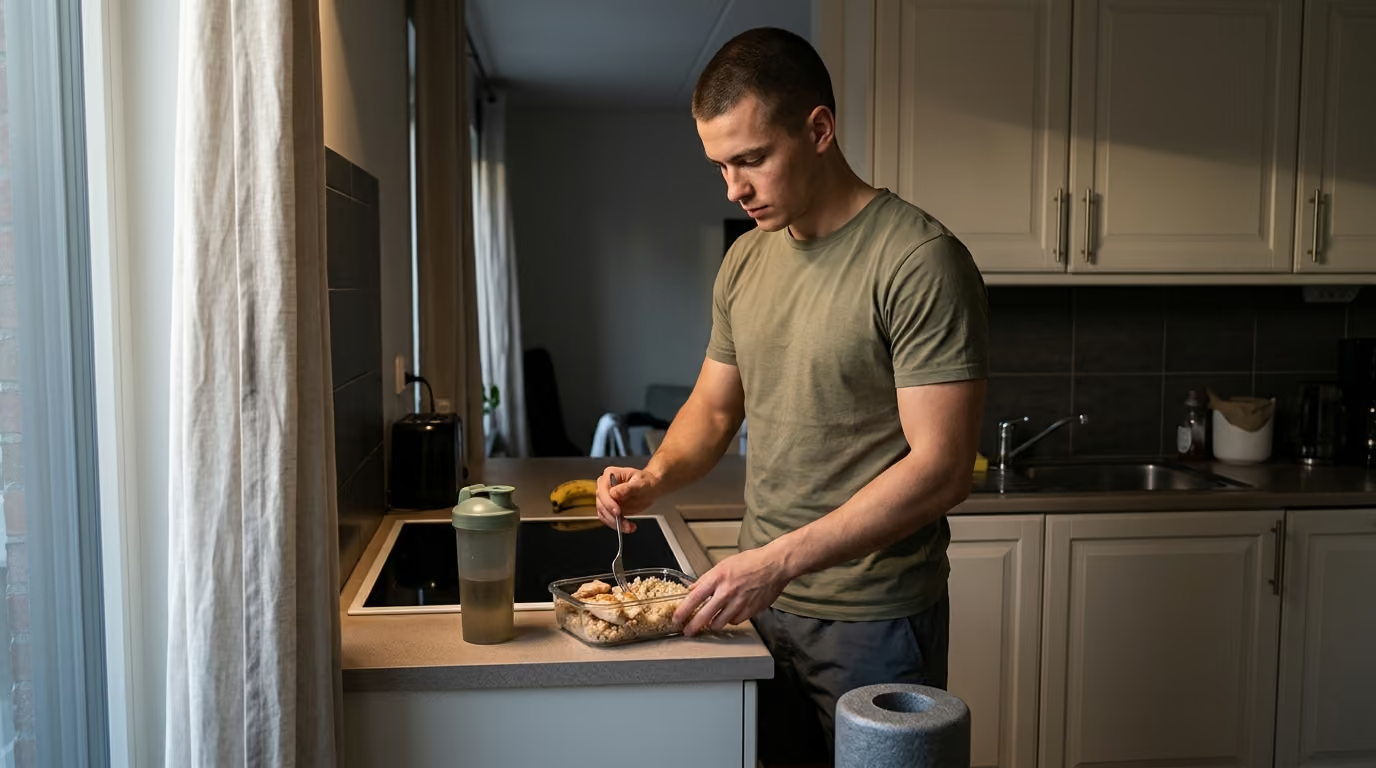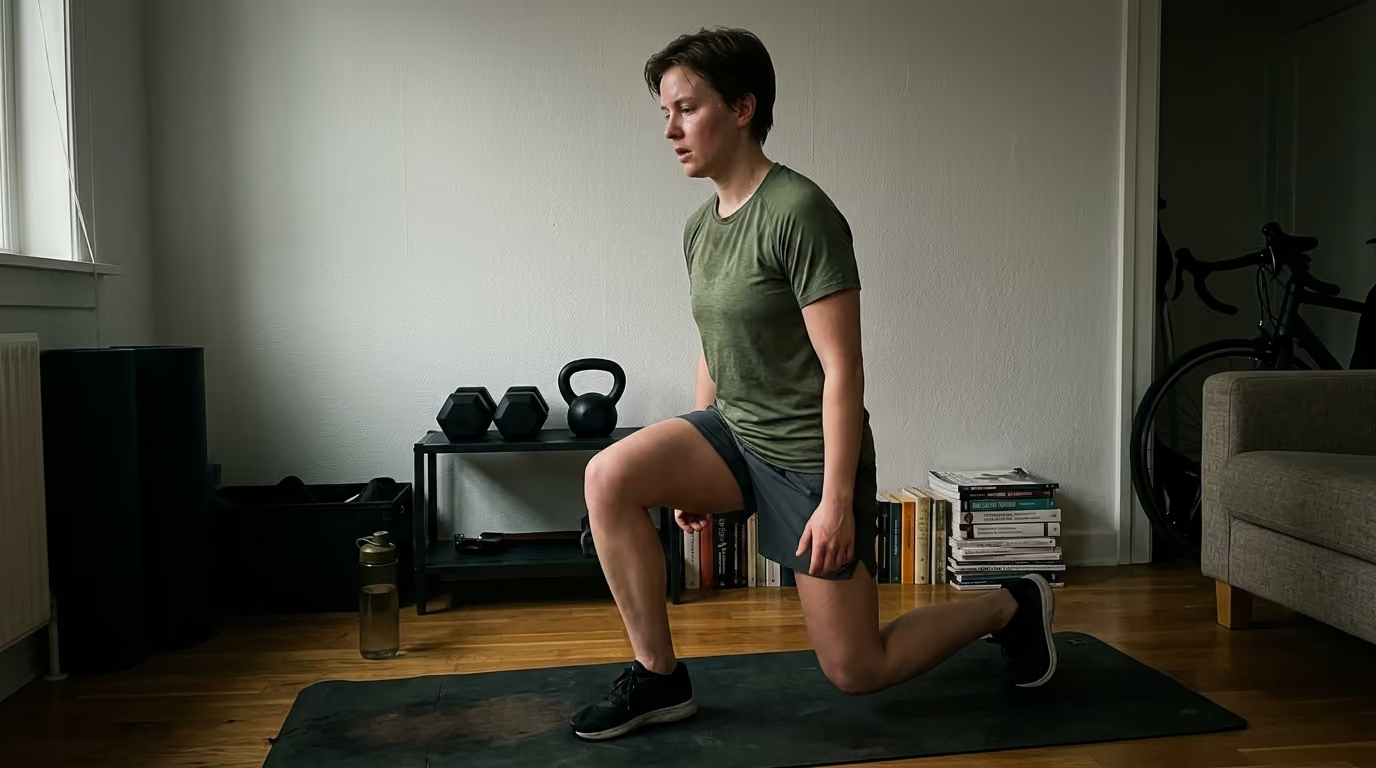

Accurate fitness benchmarks enable lifters to set realistic personal goals by accounting for individual anatomy, leverage, age, and common scoring pitfalls.





You wake up after a restless night, check your training log, and compare your deadlift to an online chart. The chart labels your lift below average for your body weight. You carried eighty pounds of gear across uneven terrain last week without a problem, yet the spreadsheet tells you that you failed.
Standard strength charts look objective, but raw numbers without context are almost meaningless. A single barbell lift or running time cannot reflect your structural leverage, health history, or occupational demands. Evaluating human performance requires looking past generic scorecards.
Physical fitness standards are valid only when you evaluate them against specific body mechanics, individual training age, and defined real-world goals.
True physical capability cannot be reduced to a single ratio or universal score. Fair standards require accounting for body mass composition, limb leverage, biological age, and movement purpose. When you understand how these variables interact, you can set targets that build genuine capability instead of chasing arbitrary numbers.
To evaluate any physical standard, you must first separate measurement from judgment. A strength test is simply a measurement taken under specific conditions. Whether that score is good, poor, or appropriate depends on the comparison group, the testing protocol, and your specific physical goals.
Understanding physical capability begins in our training and performance articles, where we emphasize that context dictates value. A standard becomes meaningful only when the test, denominator, population, purpose, and conditions are made explicit.
Absolute strength refers to the total external load moved regardless of body weight. Examples include deadlifting four hundred pounds, carrying a hundred-pound sandbag, or pressing heavy dumbbells. Absolute force is essential for tasks where the external object has a fixed weight.
In military tasks, disaster response, and heavy labor, equipment does not weigh less simply because the person moving it is lighter. Absolute strength generally favors larger individuals because larger bodies typically possess more total muscle mass.
Relative strength divides the external load by total body mass. A two-hundred-pound person lifting three hundred pounds has a relative strength score of 1.5. A one-hundred-pound person lifting one hundred and fifty pounds earns the exact same ratio.
Relative strength is useful for gymnastics, sprinting, obstacle courses, and bodyweight calisthenics. In these movements, your body mass represents the primary resistance you must move through space.
Body mass is an imperfect denominator for relative strength. Total body weight includes skeletal muscle, bone, organs, water, and noncontractile fat tissue. Fat mass does not generate mechanical force, so a simple bodyweight ratio penalizes individuals with higher adipose levels even if their muscle tissue is highly capable.
A comprehensive review on allometric scaling by researchers in sports science concluded that body-mass exponents differ based on adiposity. The researchers confirmed that fat-free mass is the superior denominator when scaling human strength to body size.
Fat-free mass includes all tissue in the body except stored fat. It accounts for muscle, internal organs, bone mineral content, and extracellular fluids. While fat-free mass correlates better with strength than total body weight, it is still not identical to skeletal muscle mass alone.
Different assessment tools, such as dual-energy X-ray absorptiometry, bioelectrical impedance, ultrasound, and magnetic resonance imaging, provide different estimates of lean mass. More lean tissue creates greater potential for force production, but it does not guarantee high output.
Specific strength describes the force produced per unit of muscle cross-sectional area. This metric assesses how effectively a specific volume of muscle generates tension. Specific strength is determined by neural recruitment, motor unit firing rates, tendon stiffness, muscle fascicle length, and muscle fiber pennation angles.
A study published in the European Journal of Applied Physiology examined untrained adults and found a significant correlation between muscle cross-sectional area and maximum force. However, the researchers also observed that the ratio of strength to muscle area varied based on individual training status and neural drive. Muscle volume matters, but neural coordination and movement skill remain decisive factors.
Allometric scaling provides a mathematical method to compare strength across different body sizes. Simple ratios assume that strength scales in direct proportion to body mass in a linear fashion. Biomechanics research shows this assumption is flawed. Geometric scaling principles show that muscle cross-sectional area and strength increase with the square of height, while body mass increases with the cube of height.
Allometric equations use a power function to account for this nonlinear reality. A review of scaling models demonstrated that the ideal body-mass scaling exponent for lean populations is roughly 0.66 for females and up to 1.0 for males, whereas lower exponents apply to individuals with higher body fat.
Allometric scaling is a helpful statistical tool, but it is not an absolute measure of fairness. The ideal mathematical exponent shifts depending on whether the movement is an upper-body press or a lower-body lift. It also changes based on age, sex, athletic background, and whether the test measures absolute force, power, or sustained endurance.
You can find more foundational material in our strength, fitness and body composition resources to help interpret these variables accurately. No single formula can eliminate the distinct mechanical realities of different body types.
Strength performance is not simply a biological test of muscle mass. It is a mechanical test of joint torque. Joint torque represents the rotational force required around an axis, calculated by multiplying the muscular force by the perpendicular distance to the joint center, known as the moment arm.
Longer limbs create longer external moment arms. When an external moment arm increases, your muscles must produce substantially more internal force to move the exact same barbell weight. Anatomical variations dictate the mechanical difficulty of any given exercise.
In the barbell back squat, structural variations in femur length, pelvic anatomy, and ankle mobility determine your optimal movement pattern. An individual with long femurs and a shorter torso must lean forward significantly to keep the system center of mass over the midfoot. This forward angle creates a large moment arm at the hip joint, requiring immense gluteal and spinal erector force.
A lifter with short femurs and a long torso can remain remarkably upright, shifting mechanical work toward the quadriceps. Biomechanical research published in the Journal of Strength and Conditioning Research confirms that limb proportions alter joint moments and bar paths, but overall muscle mass and training history remain the primary predictors of long-term squat performance.
Deadlift mechanics reflect similar anatomical constraints. Lifters with long arms and short torsos have a distinct mechanical advantage in conventional deadlifts because the barbell travels a shorter total distance. Their starting hip position can remain closer to the barbell, reducing the torque demand on the lumbar spine.
Conversely, an individual with short arms and long legs must start from a deeper hip flexion angle, pulling the bar through an extended range of motion. A biomechanical analysis of deadlift variations revealed that while femur length influenced concentric ankle work, arm and trunk lengths explained surprisingly little of the total ground reaction force or barbell velocity. Skeletal proportions shape your technique, but they do not place a hard ceiling on your ultimate capacity.
Upper-body pressing movements are heavily influenced by arm length, rib cage depth, and shoulder girdle architecture. A person with a deep rib cage and shorter humerus bones will move a barbell through a much shorter linear distance during a flat bench press. A lifter with long arms must push the bar through a wider range of motion, requiring more total mechanical work to complete the rep.
Because of these structural variations, standardized testing protocols must establish strict performance rules. Fair testing requires specifying the allowable grip width, bar touch point, pause duration, back arch limit, and whether specialty bars are allowed.
Evaluating performance across biological sexes requires distinguishing between baseline averages and individual adaptation potential. Population averages should never be used as a ceiling for what an individual can achieve.
Initial differences in absolute strength between males and females are largely explained by differences in total fat-free mass and body size. On average, adult males possess greater total muscle mass and bone mineral content, particularly throughout the upper body and shoulder girdle.
When training interventions are evaluated relative to baseline values, the biological response between sexes is remarkably similar. A comprehensive systematic review published in Sports Medicine analyzed resistance training adaptations between males and females across multiple age groups.
The researchers found no significant differences in relative muscle hypertrophy between sexes. Both groups gained muscle mass at comparable percentage rates when training protocols were equated for relative intensity and volume.
The same systematic review revealed that relative lower-body strength gains were nearly identical between males and females. In upper-body exercises, female participants frequently exhibited larger relative strength improvements compared to male participants.
This pronounced relative gain occurs partly because untrained females often start with lower baseline upper-body strength. When exposed to structured progressive overload, their neuromuscular system adapts rapidly.
A meta-analysis published in PeerJ examined resistance training in adults over the age of fifty. The investigators noted that while absolute muscle size increases slightly favored older males due to baseline volume, relative muscle hypertrophy showed no significant difference between older men and older women.
Age-related anabolic signaling functions effectively in both sexes when appropriate mechanical tension is applied. Performance standards should record both absolute loads and relative changes over time to capture true individual progress.
Scientific resources must separate biological classifications in research from complex administrative categories. Research on biological sex differences focuses on neuromuscular physiology, skeletal dimensions, and hormone concentrations.
Administrative sport standards, military occupational guidelines, and fitness testing categories apply these biological findings to specific functional roles. When evaluating personal fitness, prioritize your individual health history and baseline capacity over generic demographic charts.
Physical capability changes across your lifespan, making unadjusted standards inappropriate for comparing adults of different ages. Cardiorespiratory fitness and maximum muscle power naturally decline over decades if physical activity is discontinued.
A large normative study published in the Brazilian Archives of Cardiology examined treadmill cardiopulmonary exercise tests across thousands of adults. The data showed that median maximal oxygen uptake declined from 44.7 to 28.4 mL·kg⁻¹·min⁻¹ in men and from 36.3 to 22.3 mL·kg⁻¹·min⁻¹ in women between the third and seventh decades of life.
This decline is a common population pattern rather than an unavoidable biological fate. Sedentary living, medical conditions, body composition shifts, and chronic sleep disruption accelerate functional decline.
Our recovery and sleep articles explore how daily restorative habits preserve your training capacity. Structured physical training substantially slows down the rate of cardiorespiratory and muscular decline.
Research on master athletes proves that chronic training preserves muscle architecture and functional power well into older age. A landmark study published in The Physician and Sportsmedicine evaluated high-performing master athletes aged forty to eighty-one. The researchers found no significant age-related loss of muscle mass or performance in chronic exercisers who maintained consistent training volumes.
A systematic review published in Ageing Research Reviews similarly confirmed that master athletes preserve exceptional levels of muscle strength, fiber size, and body composition in an exercise-mode-specific manner. High physical capacity is maintainable across decades with dedicated training.
Training age represents the total duration of structured, purposeful exercise you have completed, which is distinct from chronological age. A novice with a training age of three months experiences rapid progress due to neural adaptations, motor skill learning, and intra-muscular coordination.
An advanced athlete with a training age of fifteen years operates close to their genetic potential. For the advanced lifter, progress requires precise volume management, periodization, and recovery protocols.
A recent meta-analytic report examining strength gains across different performance levels found that beginners experience the largest relative strength increases. The report found less variation in the rate of adaptation between intermediate, advanced, and highly advanced lifters.
Because this finding comes from a single large meta-analytic model, it serves as valuable emerging data rather than settled dogma. It reinforces that a sixty-year-old beginner and a sixty-year-old competitive lifter require entirely different performance standards.
Chronological age and training history interact to determine your optimal training volume. An older beginner can make rapid improvements in strength and mobility because their neuromuscular system is highly responsive to new stimuli.
An older veteran lifter must manage total joint volume, recover from accumulated wear, and use thoughtful exercise variations. You can find more details on long-term wellness strategies within our healthy aging articles. Always judge progress against your personal baseline and injury profile rather than young athlete charts.
Fitness is multidimensional. It encompasses maximal strength, submaximal endurance, power, aerobic capacity, mobility, balance, and recovery tolerance.
A powerlifter may possess exceptional lower-body strength while lacking aerobic conditioning. A distance runner may maintain outstanding cardiorespiratory fitness but struggle with basic loaded carries.
The World Health Organization physical activity guidelines recommend 150 to 300 minutes of moderate-intensity aerobic activity, or 75 to 150 minutes of vigorous-intensity activity weekly, alongside muscle-strengthening exercises on two or more days per week. For older adults, the World Health Organization emphasizes multicomponent balance and functional training on three or more days per week. These guidelines establish minimum health requirements rather than competitive athletic performance standards.
When interpreting fitness and strength standards, avoid these ten common analytical errors:
Using a simple load-to-bodyweight ratio penalizes taller individuals and those with higher noncontractile fat tissue. Allometric scaling or lean mass denominators provide a much fairer comparison across diverse body sizes.
A trap bar deadlift, conventional straight-bar deadlift, and leg press are not interchangeable tests. Each variation imposes different spinal shear forces, joint angles, and mechanical advantages.
Muscle cross-sectional area correlates with force output, but neural drive, tendon compliance, and movement skill account for massive individual performance variations.
While limb lengths influence bar path and joint moments, biomechanical evidence shows they do not prevent meaningful strength adaptations. Leverage is a setup constraint to solve, not an excuse to quit.
A competitive lifter possesses years of technical refinement and connective tissue remodeling. Novices must measure progress against their own previous month rather than elite standard scorecards.
Scoring in the fiftieth percentile of an athletic dataset does not mean you have a health deficit. Percentiles only show your ranking within that specific cohort, not your functional independence.
A comprehensive review in Sports Medicine on one-repetition maximum testing demonstrated that 1RM tests have high reliability. However, studies show that untrained adults improve their 1RM scores by 10 to 20 percent over four sessions purely through motor learning and testing familiarization.
Cardiopulmonary exercise test standards derived from a motorized treadmill cannot be directly compared to scores from a stationary cycle ergometer or a field-based run. Cycle tests generally yield lower peak oxygen uptake values due to localized quadriceps fatigue.
Meeting public health activity minimums supports cardiovascular and metabolic wellness. It does not automatically produce elite power, speed, or body composition.
Research on master athletes confirms that high-intensity resistance and endurance exercise preserve functional capability well into advanced age. Biological aging alters recovery rates, but it does not stop progressive adaptation.
Evaluating practical case studies demonstrates why rigid standards fail when applied without context.
Consider Athlete A, who weighs 132 pounds and squats 264 pounds. Athlete B weighs 198 pounds and squats 396 pounds. Both athletes achieve a 2.0 bodyweight ratio.
However, Athlete B moves 132 pounds more external load, placing far greater compressive force on their skeletal structure. Athlete A excels in bodyweight movements, while Athlete B possesses far higher absolute capability for heavy occupational carries.
Athlete C weighs 154 pounds and deadlifts 308 pounds, achieving a 2.0 ratio. Athlete D weighs 220 pounds and deadlifts 374 pounds, achieving a 1.7 ratio.
Athlete D is significantly stronger in absolute terms and will move real-world obstacles more easily. If Athlete D carries thirty pounds of noncontractile fat, simple bodyweight ratios understate their functional muscle strength.
Two athletes have identical body mass, body composition, and quadriceps cross-sectional area. Athlete E has long femurs and a short torso, while Athlete F has short femurs and a long torso.
During a back squat to parallel, Athlete E must flex forward substantially, creating a massive moment arm at the hip. Athlete F stays upright, reducing spinal shear forces. Both are training effectively, but their movement mechanics and leverage demands look completely different.
A sixty-two-year-old individual begins structured strength training and increases their leg press from 100 pounds to 180 pounds in four months. A twenty-five-year-old who has lifted for eight years increases their squat from 400 pounds to 410 pounds over the same period.
The older novice achieved an 80 percent improvement through rapid neural adaptation, while the experienced lifter achieved a 2.5 percent gain near their genetic ceiling. Both outcomes represent outstanding, appropriate progress.
A recreational strength athlete can bench press 315 pounds and deadlift 500 pounds, but scores in the twenty-fifth percentile for age-adjusted VO2 max.
This individual is not broadly unfit, but they have specialized heavily in anaerobic force production. Their health and long-term stamina would benefit from adding structured aerobic base training.
An older adult performs well on slow, machine-based leg extensions but struggles to step quickly onto a curb or catch their balance during a trip. Maximal slow-speed strength does not automatically confer rapid force development or stability.
This individual requires balance training, medicine ball throws, and rapid step drills to maintain independence and prevent falls.
Setting fair, actionable physical targets requires a systematic approach. Rather than adopting an unverified online chart, use this eight-step framework to establish personal baselines and track progress.
Identify exactly what quality you need to develop. Your primary goal might be building absolute load capacity, increasing cardiorespiratory endurance, improving functional mobility, or supporting healthy aging. A clear goal prevents using irrelevant metrics.
Match your assessment tool directly to your chosen objective. If you want lower-body strength, choose a consistent squat or deadlift variation.
If you want upper-body pressing capacity, choose the overhead press or push-up test. For aerobic endurance, use a standardized 1.5-mile run, 12-minute Cooper test, or calibrated rowing ergometer protocol.
Document your starting metrics under strictly standardized conditions. Record the following details:
Select a reference framework that matches your status. Compare yourself against your own historical baseline, age- and sex-stratified population percentiles, or specific occupational requirements. Avoid comparing novice progress against competitive athlete standards.
Decide how your performance should be scaled. Use absolute external weight if you are training to move fixed heavy objects.
Use bodyweight ratios if you are training for gymnastics, calisthenics, or running. Use fat-free mass scaling if you are evaluating physiological strength efficiency across different body sizes.
Establish a balanced mix of outcome numbers and daily behavioral habits. An outcome target might be adding twenty pounds to your deadlift or shaving forty seconds off your run over twelve weeks.
Your process targets must specify your weekly consistency, such as completing two full-body strength sessions and two aerobic workouts each week. More practical guidance is available in our healthy aging and longevity resources.
Schedule re-testing sessions every eight to twelve weeks. Maintain rigorous protocol consistency by matching the exact warm-up, rest times, bar speed expectations, and exercise depth.
Studies show that repetition maximum tests at moderate loads (around 70 percent of 1RM) often display higher test-retest reliability than near-maximal tests for intermediate lifters. If using estimated 1RM calculations from submaximal sets, always use the same mathematical formula.
Look at multi-month trends rather than single-session fluctuations. A meaningful fitness target should improve your energy, physical resilience, and daily physical capability. If your test scores improve but your joints ache and daily function declines, your training program requires adjustment.
Before undertaking maximal strength testing, high-intensity aerobic challenges, or aggressive physical training programs, consult a qualified healthcare professional. This is essential if you have pre-existing cardiovascular conditions, joint injuries, metabolic disorders, or have been physically inactive.
A physical therapist, clinical exercise physiologist, or certified strength specialist can help tailor testing protocols to your injury history and structural profile. Laboratory diagnostics and movement screenings ensure that your training supports long-term physical capability without unnecessary injury risk.
Different platforms draw their data from vastly different source populations. Some online calculators rely on user-submitted gym logs, which skew heavily toward younger, highly experienced male lifters.
Other tables use competitive powerlifting federation results, representing the top tier of strength athletes. Clinical and public health databases use representative random samples from the general population, which include inactive adults. Always verify the source population behind any scoring table.
For most non-competitive lifters, estimating a one-rep max from a controlled three- to five-rep set is safer and equally useful for tracking progress. Direct 1RM testing places intense mechanical stress on joints and connective tissues, requiring high technical skill under extreme fatigue. Submaximal repetition testing reduces acute injury risk while providing reliable data for programming adjustments.
Limb length alters the moment arms around your joints and dictates the linear distance an external weight must travel. A lifter with long femurs will experience higher hip torque during a squat, while a lifter with long arms will pull a deadlift with different spinal angles than someone with short limbs. However, research confirms that limb lengths do not prevent significant muscular adaptation. Proportions require you to adjust your technique, but they do not prevent you from getting strong.
Yes. Clinical studies consistently demonstrate that older adults, even those entering their seventh or eighth decade, experience substantial neuromuscular and hypertrophic adaptations from progressive resistance training. While baseline hormone levels and recovery rates shift with age, mechanical tension continues to stimulate muscle protein synthesis and neural recruitment. Starting later in life yields profound benefits for bone density, balance, metabolic health, and physical independence.
Meaningful physical standards do not exist to grade your worth against a generic chart. True progress is measured by building repeatable, lifelong capability that supports your health, resilience, and personal independence.
Follow BattleVet for practical guidance on military and veteran health, strength, recovery, testosterone, sleep and healthy aging. Stay connected for new articles, research backed insights and clear information to help you stay capable for the years ahead.


Build better habits around strength, recovery, sleep, hormones and healthy aging with practical guidance for active military personnel and veterans.
Explore BattleVet